Overview:
The Stock Ledger in Quantity and Value by Location Report enables users to generate a report on inventory to show the movement of the stocks together with its value by stock location.
This report will only be available if the add-on module: Multi-Location is activated.
Scenario:
Generate a Stock Ledger in Quantity and Value by Location Report from a specific date range.
Solution:
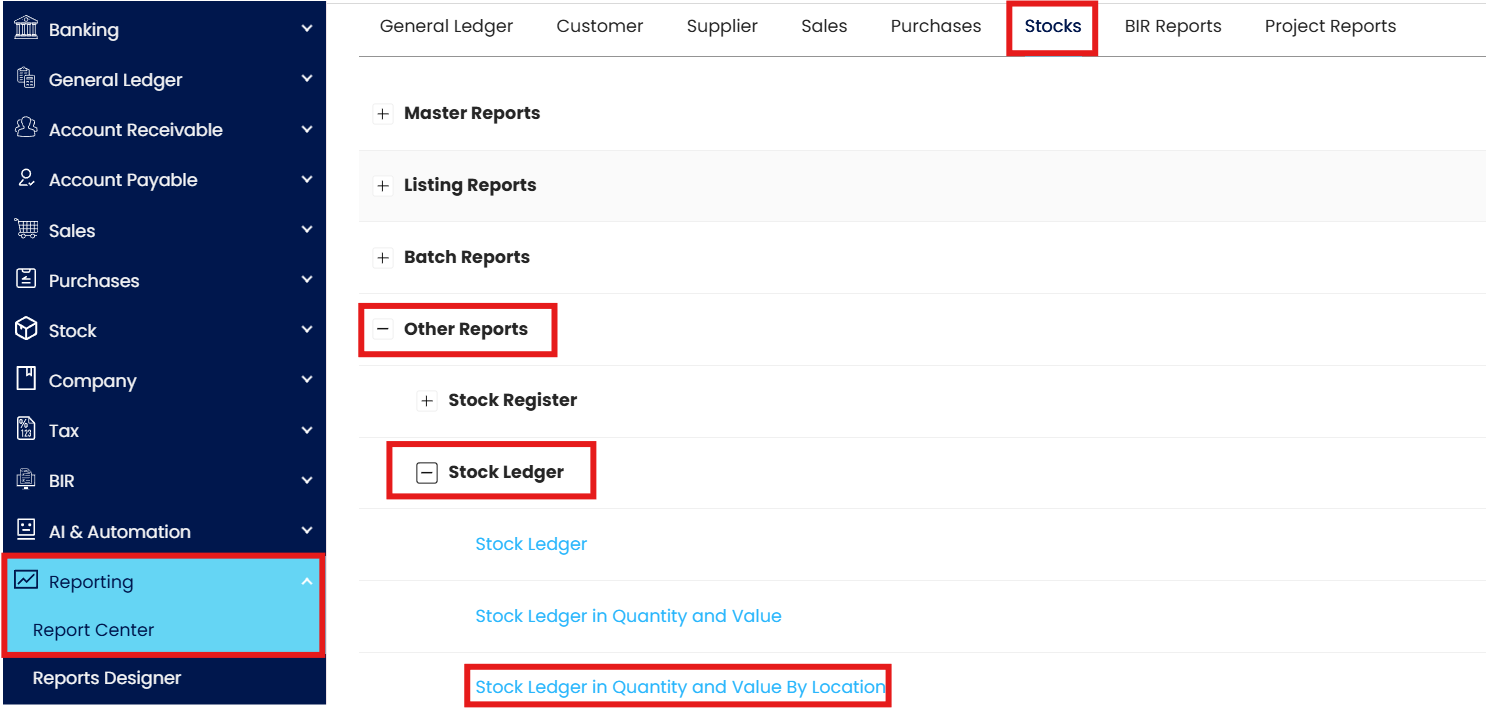
On the Navigation Pane, go to Reporting > Report Center. Under the Stocks tab, click Other Reports > Stock Ledger > Stock Ledger in Quantity and Value By Location.
In the Stock Ledger in Quantity and Value by Location screen, set the parameters that will filter the generated report.
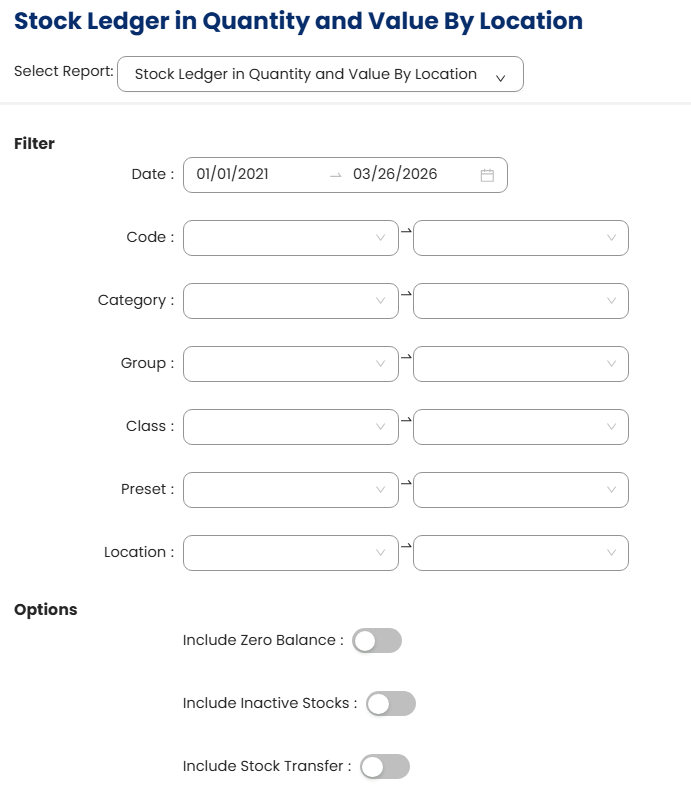
Filters:
Date: Specify a date range.
Code: Select the Stock Code.
Category: Select the stock category.
Group: Select stock group.
Class: Select stock class.
Preset: Select predefined stock presets.
Location: Select stock locations.
Options:
Include Zero Balance: Include stocks with zero balance.
Include Inactive Stocks: Include stocks that are inactive.
Include Stock Transfer: Include stock transfer transactions.
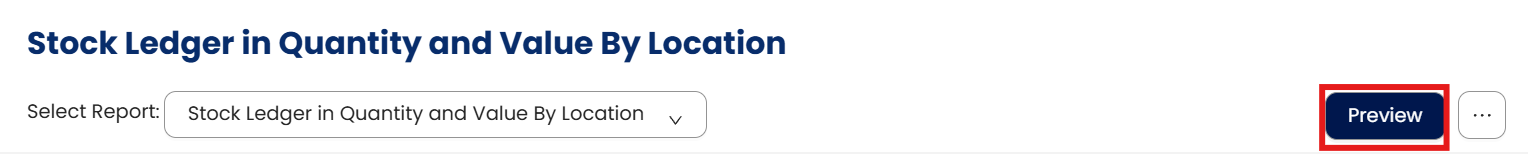
Once done with filtering, click ‘Preview.’ This will show the report based on the selected report format.
The generated report may also be exported by clicking the ‘Export To’ icon. This will show all the available file formats.
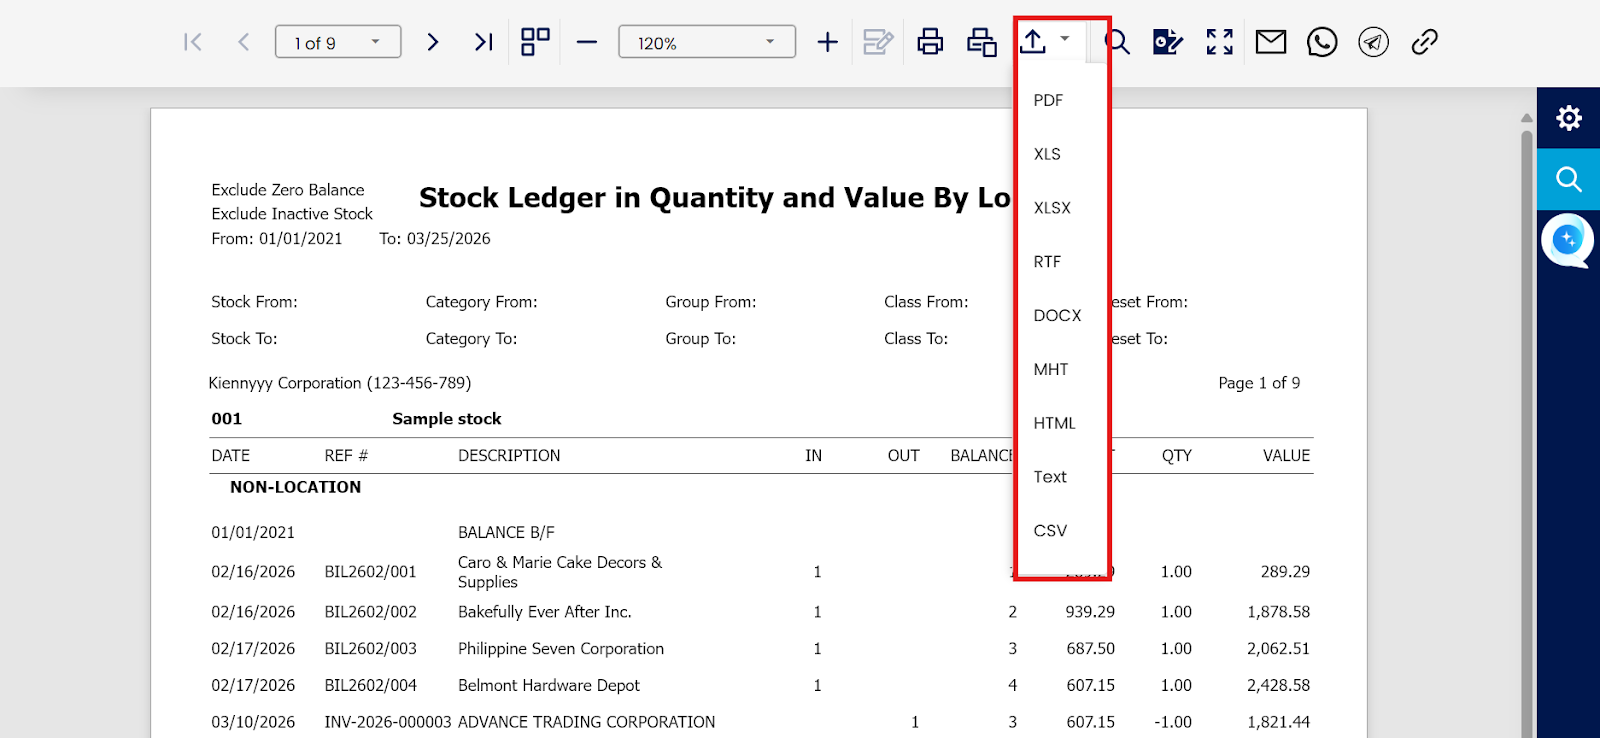
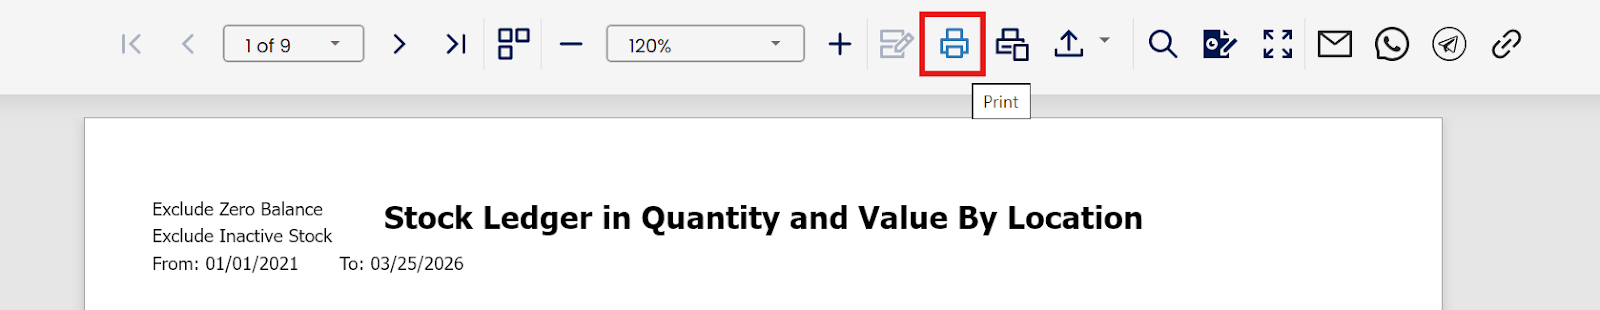
To Print, click the ‘Print’ icon.
Application:
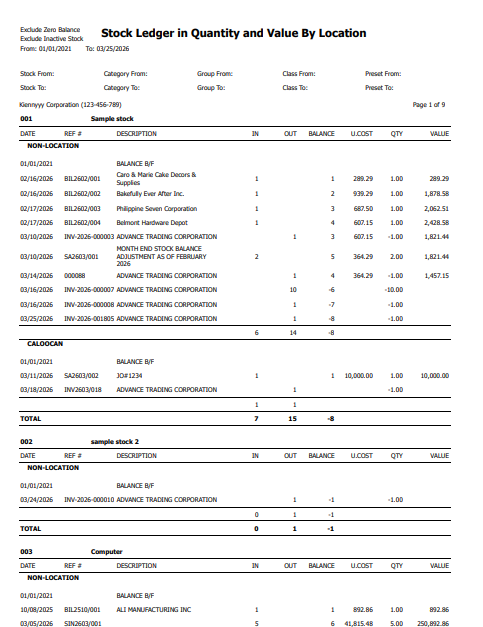
You can now view the generated Stock Ledger in Quantity and Value by Location Report.
System Scope: QNE AI Cloud Accounting / N3 AI Accounting
Was this article helpful?
That’s Great!
Thank you for your feedback
Sorry! We couldn't be helpful
Thank you for your feedback
Feedback sent
We appreciate your effort and will try to fix the article